Silt Measurement Data Examples by GeoScope 200
2022-05-16
Products:GeoScope 200 Submersible
Date:Feburary 2022
Location:A river in Shanghai
Installation: Towed floating rafts
Towing Speed:3 knots

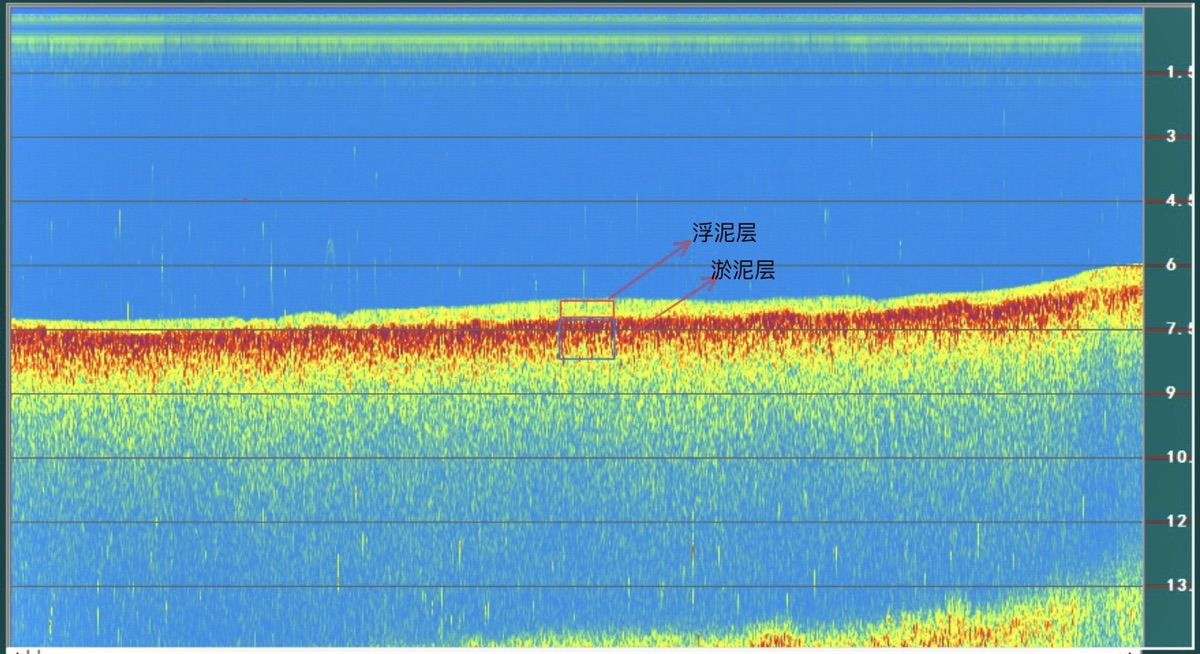
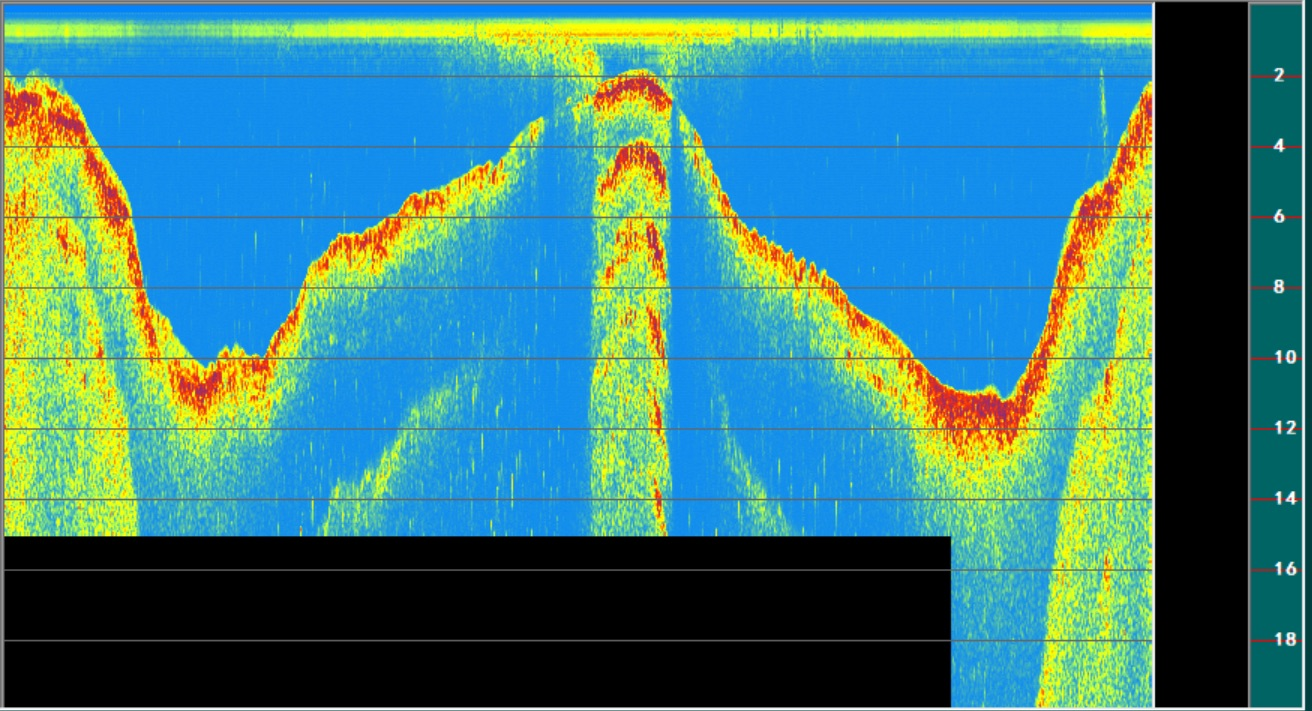
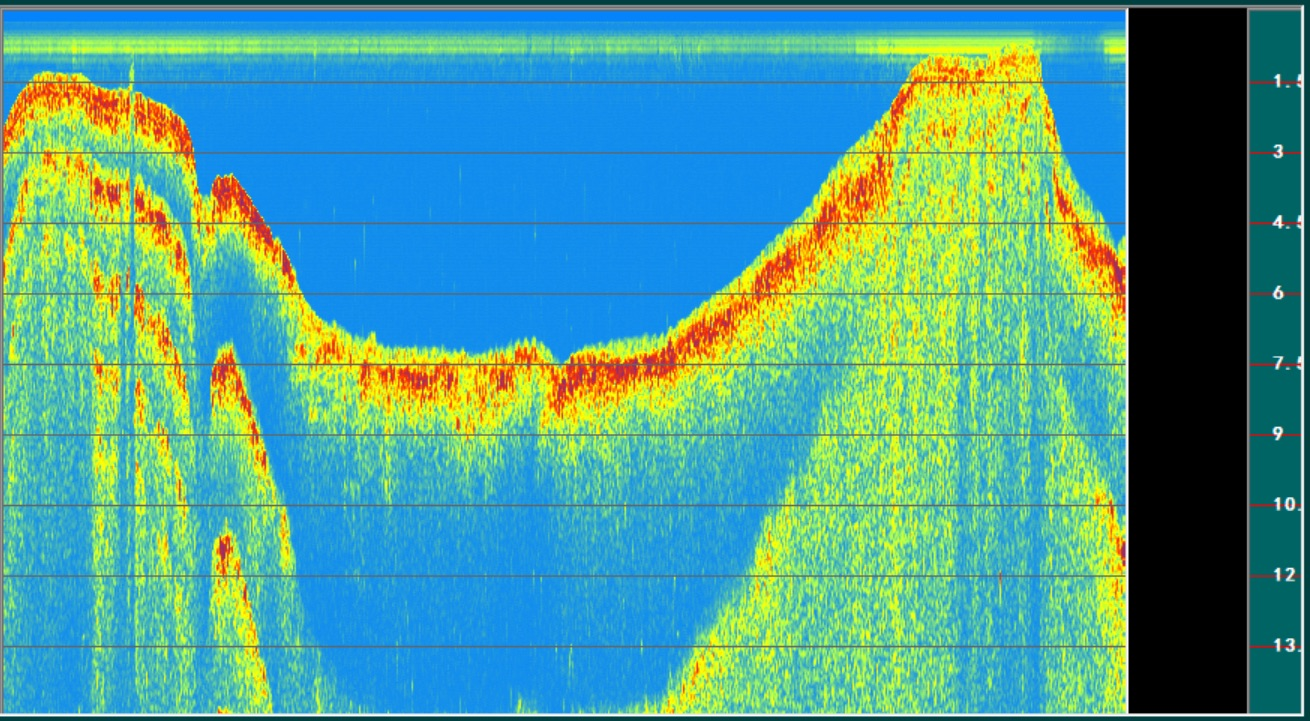
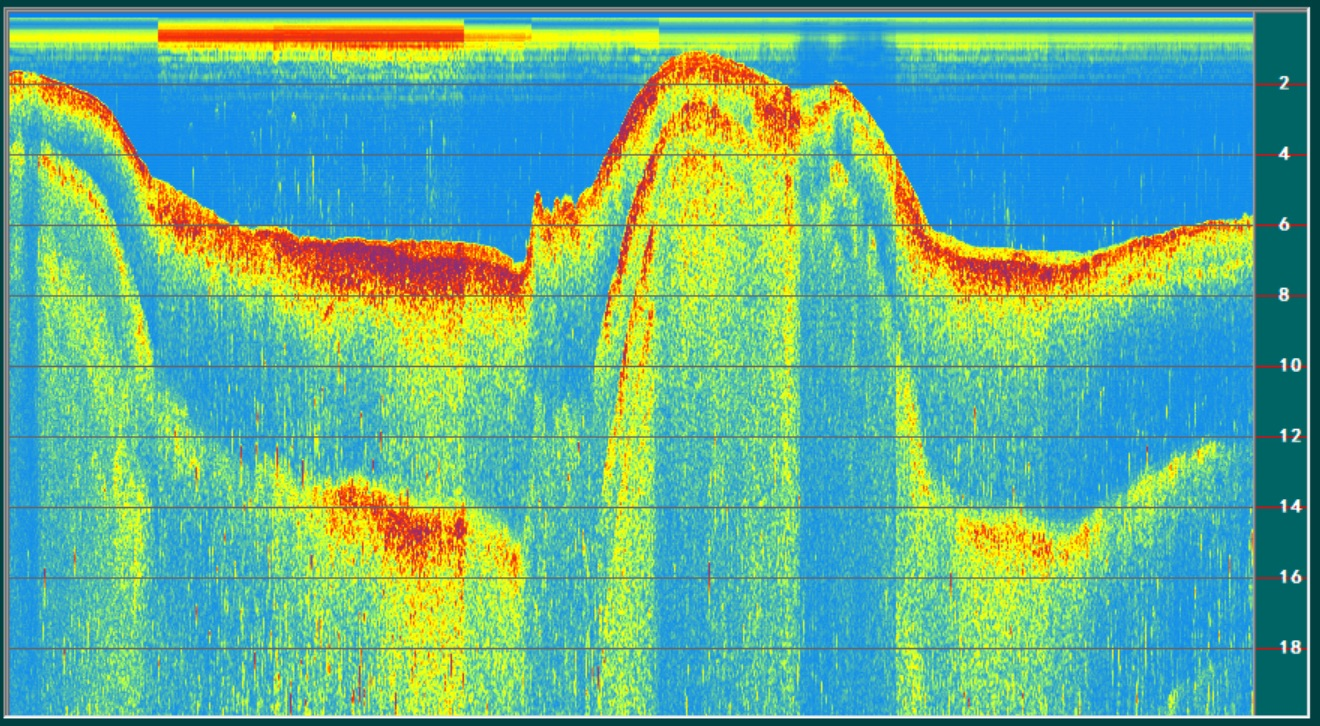
Data Examples:


Note: The floating mud and silt layers annotated in this figure are only annotated after borehole sampling and comparison. Normally, the colour change and layering on the data is the result of the combined effect of the acoustic impedance of the medium and the TVG, and is not the result of the real stratigraphy. Before sampling and calibration, these stratigraphic profiles can only be used as an approximate reference and cannot be used as an output for qualitative and quantitative results. In the actual measurement, if we want to get qualitative and quantitative results, we need to do borehole sampling on a specific coordinate stratigraphic data, match the acoustic impedance correction according to the sampling results, and then deduce according to the corrected parameters, in order to have a more accurate estimation result in the same measurement area.


